This article is about how we saved $13,000 due to indentation misconfig, how we investigated the issue, and the lessons we learned.
Intro: The System
SolidusLabs is the category-definer for crypto-native market integrity solutions – trade surveillance, transaction monitoring, and threat intelligence. The company has teamed with Develeap to build a stable and secure cloud architecture for their applications.
SolidusLabs’ SaaS application is deployed on AWS’ Cloud. In terms of architecture, the system uses Java Spring-Boot and Python microservices that run in Amazon Elastic Kubernetes Service (Amazon EKS), along with managed services like Airflow, Confluent Kafka, and Snowflake.
The company’s Kubernetes microservices are located in private subnets and connected to the Internet using NAT gateways. Each availability zone has its own NAT gateway.
NAT gateway is an AWS service that allows outgoing internet connections from instances that reside within private subnets; it’s charged hourly and based on the traffic volume.
The Challenge: Optimising your cloud costs
Our story begins with an anomaly we detected in the cloud costs, specifically in the NAT gateway traffic billing.
Step zero: Identifying the root cause
Before figuring out the cause of the anomaly, we had to identify how much traffic our client was being charged for to verify whether it was a genuine concern.
To do that, we divided the NAT gateway bill by its average region pricing. The result indicated that there was indeed a discrepancy since the traffic did not match the logs, tracing, or Kafka volumes.
A deep dive investigation showed that the NAT gateway used 600 times more bandwidth than expected based on aggregated logs from all our environments. The hundreds of GB/hour observed were disproportionate to our expectations.
Once verified, we could proceed with further analysis to fix the problem.
Step one: Traffic destination analysis
Next, we investigated the traffic’s destination. Fortunately, we had stored VPC Flow Logs in Amazon Simple Storage Service (Amazon S3), which is a recommended practice as part of an AWS well-architected project. We analyzed the flow logs with Amazon Athena (here is an excellent guide). The outcome was a long list of external IPs and the traffic volume sent to each. While some IP addresses stood out due to unusually high flow, we faced the challenge of mapping these IPs to their cloud providers.
Map the IPs to their cloud providers
When we use cloud-managed services such as Snowflake and Confluent, they serve us according to our cloud provider. During cluster creation, we are prompted to specify the cloud (and region) we use, such as AWS or other cloud providers. As a result, the cluster is created within the same cloud (and region) as ours. When searching for the destination IPs, the only thing we discovered was that they belong to AWS. But who is the actual vendor behind it?
To move forward, we initiated the process by opening support tickets with AWS and other cloud providers to clarify the IP mapping. We got a quick response from AWS, confirming that the IPs belong to a specific account and VPC. After contacting Confluent Cloud support, we got approval that this number is their AWS account serving SolidusLabs.
Once we have the IPs traffic destination information, we can focus on the Kafka settings.
Step two: Locating the source of the trouble
Our next step was understanding if the traffic was coming from the infrastructure or the compute layers. To check this, we deployed an “empty” testing environment that did not include any microservices. We found that no traffic was detected.
Next, we had to understand whether the traffic was distributed throughout the system or generated by a specific workflow. We assumed that all SolidusLabs microservices communicating with Kafka do it the same way, but this hypothesis had to be checked.
To check whether we could identify a single source of the problem, we recorded the average traffic per hour in one of the test environments and started disabling the suspect services one by one. After removing each microservice, we examined the differences in the traffic rate using our Athena table. Soon after, we identified the problematic microservice.
Still, we weren’t sure whether this microservice was solely responsible for generating the traffic or if it resulted from the entire data pipeline.
Step three: Traffic source analysis
Our next step was identifying the exact source of the extensive egress traffic. We used Wireshark to sniff outgoing TCP traffic. We then forwarded the TCP traffic from K8s to the local Wireshark using the excellent ksniff kubectl plugin.
We started catching the traffic, and… Wireshark crashed after 7 seconds..! To bypass this, we captured a 1-minute sample of the traffic to a local file (the file size was 100MB) and opened it in Wireshark. After 20 minutes of processing, Wireshark had parsed about half of the file, and we decided that it was enough – the picture was as follows:
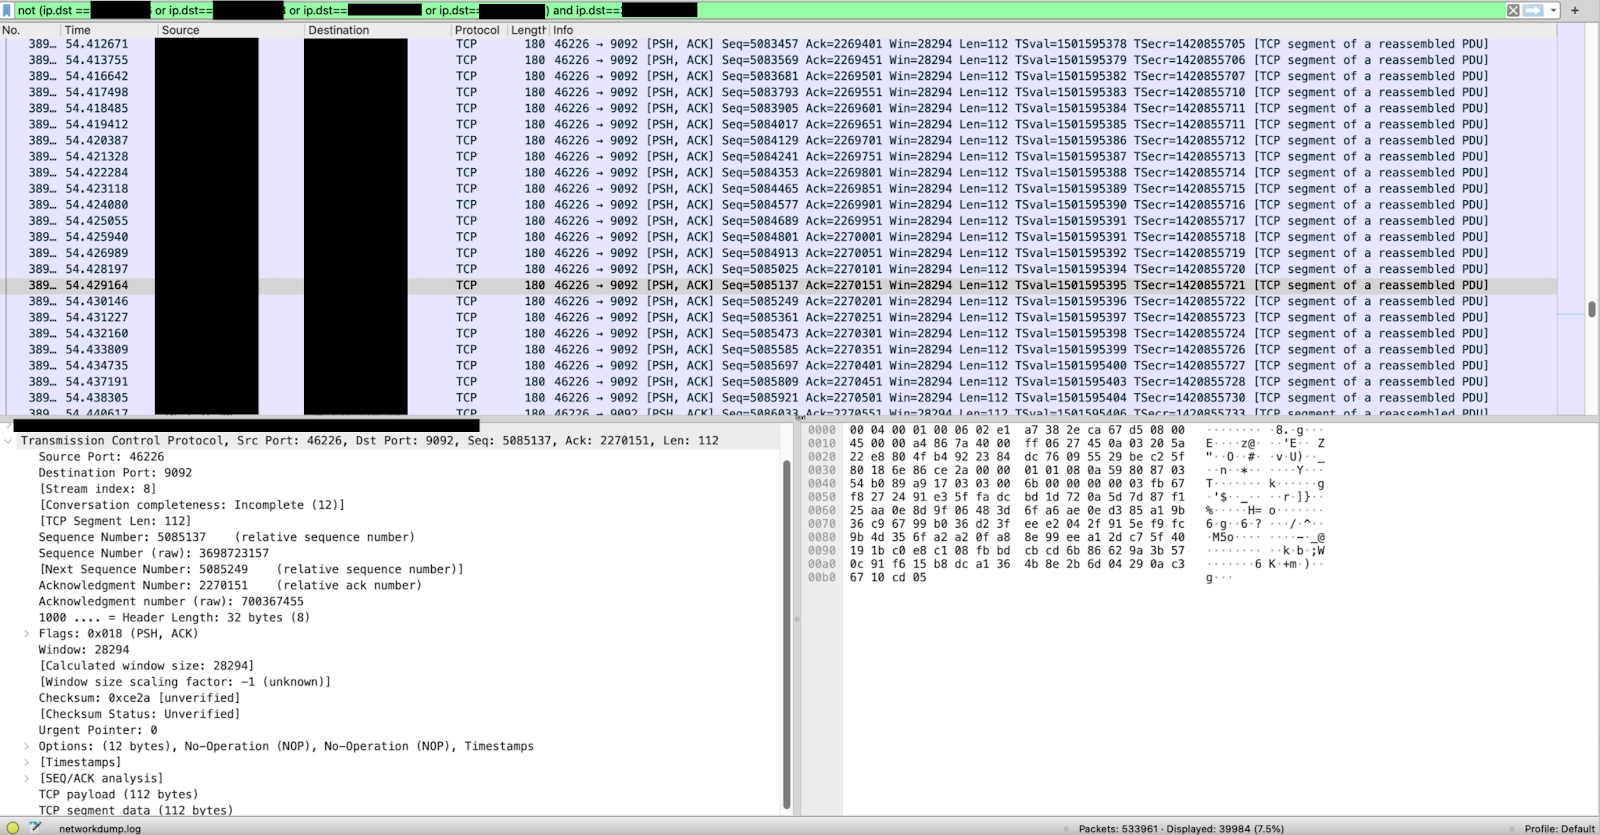
TCP packets captured by Wireshark.
We saw about 500,000 packets/min (!). These were empty TCP packets (with no payload data) – thousands of requests per second. From a single Pod (replica) and from a single environment! For reference, other services of SolidusLabs, connected to Kafka, had about 1500 packets/min.
We verified that the port was 9092 (Confluent broker port) and that the IPs belong to our Confluent. The lack of payload in the packets hinted at the traffic being endless TCP handshakes.
Step four: Digging inside the configuration
How Kafka Consumer works
Kafka responds to a consumer’s fetch request only with/after a minimum amount of data is demanded. If the requested amount of data is not immediately available, the server will temporarily delay its response until the maximum timeout is reached, at which point it will provide a response.
The misconfig we found
After checking the configuration and environment variables inside the pod, we found that it was configured with
FETCH_MIN_BYTES_CONFIG=0 (minimum data portion) and
FETCH_MAX_WAIT_MS_CONFIG=0 (max blocking timeout) spring boot variables. What this means is basically “answer immediately even if there are no new data”…! Hence our service bombarded Kafka with endless fetch requests, each replica asked for updates on every registered topic, and when we added a topic or replica, the traffic would increase proportionally.
How did it happen?
In the configuration, which is managed by Helm chart values, we override a part of the spring boot environment variables. We found that the Helm variables we used for these two keys were pointing to unexisting YAML paths in the values (due to an indentation mistake with some non-completed refactoring).
So what? Shouldn’t Helm just fail when rendering the templates in this case?
Not always… it turns out that Helm doesn’t fail for a one-level unresolved key – for example,
{{ .Values.nothing.here }}results in failure
nil pointer evaluating interface {}.herebut
{{ .Values.nothing }}is not an interface evaluation, it is just an empty value.
However, when dealing with big numbers like bytes or milliseconds (as in our case), the
intHelm function is commonly used to convert the value correctly.
The result returned by the
intfunction when given an empty value
({{ int64 .Values.nothing }})will be 0.
The last step: Fix
After fixing the indentation and updating the services, the Helm chart started consuming the correct values and we saw an immediate drop in traffic, which was reduced by 90% and back to healthy levels!
What we learned:
- Focus and ownership – Every task in the organization should have its owner, who will guide the entire process until it is resolved. Without setting ownership, we can lose the target.
- Having a Sandbox – It is very important to have lower environments where you can experiment and eliminate services. The testing environment played a significant role in achieving the final result.
- Don’t make assumptions – When solving challenging issues, assumptions might hold you back and lead you in the wrong direction. Start from a blank page and make fact-based progress.
- Cost should be discussed as part of feature design – Cost should be taken into account when planning the design. Understanding the cost will help you in choosing the right tools and technologies.
- Cost alerting should be configured to detect cost anomalies and avoid unpleasant surprises at the end of the month
- VPC Flow Logs should be enabled. It can be a lifesaver when faced with a crisis.