The well-known EFK/ELK stack, which includes Elasticsearch, Fluentd (or Logstash) & Kibana, is a standard centralized logging platform nowadays.
If you had deployed this stack on your Kubernetes cluster, at some point, you might ask yourself — “Can I export these dashboards out?” or “Can I import ‘built-in’ dashboards & index-pattern (data view) to a brand new Kubernetes cluster?” or “Can I have a one-click EFK stack installation including all the dashboards configured in place?” So yes, you can.
This is exactly the challenge I faced more than a year ago while deploying this kind of stack to a Kubernetes cluster, and I’m still facing it today.
In the following blog post, I’ll show you how to export and import Kibana dashboards and index-pattern (data view) manually using the Kibana API & automatically using ConfigMaps, Kubernetes Jobs & Helm Hooks so that when you deploy your applications and your logging tools, you will also deploy ‘built-in’ Kibana dashboards within your EFK stack.
UPDATE: index-pattern — > data view
Please note that Elastic has renamed the ‘index-pattern’ object to ‘data view’. However, we can still use the ‘index-pattern’ name when we will import it later using the Kibana API.
In this blog post, from now on, I’ll use the name ‘data view’.
Kibana API
You can use Kibana’s API for plenty of purposes, such as importing/exporting data views & dashboards. This is perfect for configuring Kibana in an automated way, like we love to do in DevOps.
Moreover, down below, you’ll find some ‘missing’ variables, such as ${KIBANA_PORT} or ‘user:pwd’ on the CURL commands — make sure you’re replacing them with your relevant data.
Export data view using Kibana API
So, first of all, we need a data view to index our logs. In our use case, we had a data view that’s used for our Kibana. I wanted to export it so I’ll be able to import it later whenever I want.
We can do so using the Kibana API. This is pretty straightforward, just follow the command below (make sure you are replacing ${KIBANA_URL}, ${KIBANA_PORT}, user:pwd, and lastly the ${DATA_VIEW_ID}):
curl - user user:pwd -X POST https://${KIBANA_URL}:${KIBANA_PORT}/api/saved_objects/_export -H 'kbn-xsrf: true' -H 'Content-Type: application/json' -d '{
"objects": [
{
"type": "index-pattern",
"id": "${DATA_VIEW_ID}"
}
]}'
You can get your data view ID by navigating to the data views web page on Kibana, and you’ll see the ID at the address bar as a part of the URI:
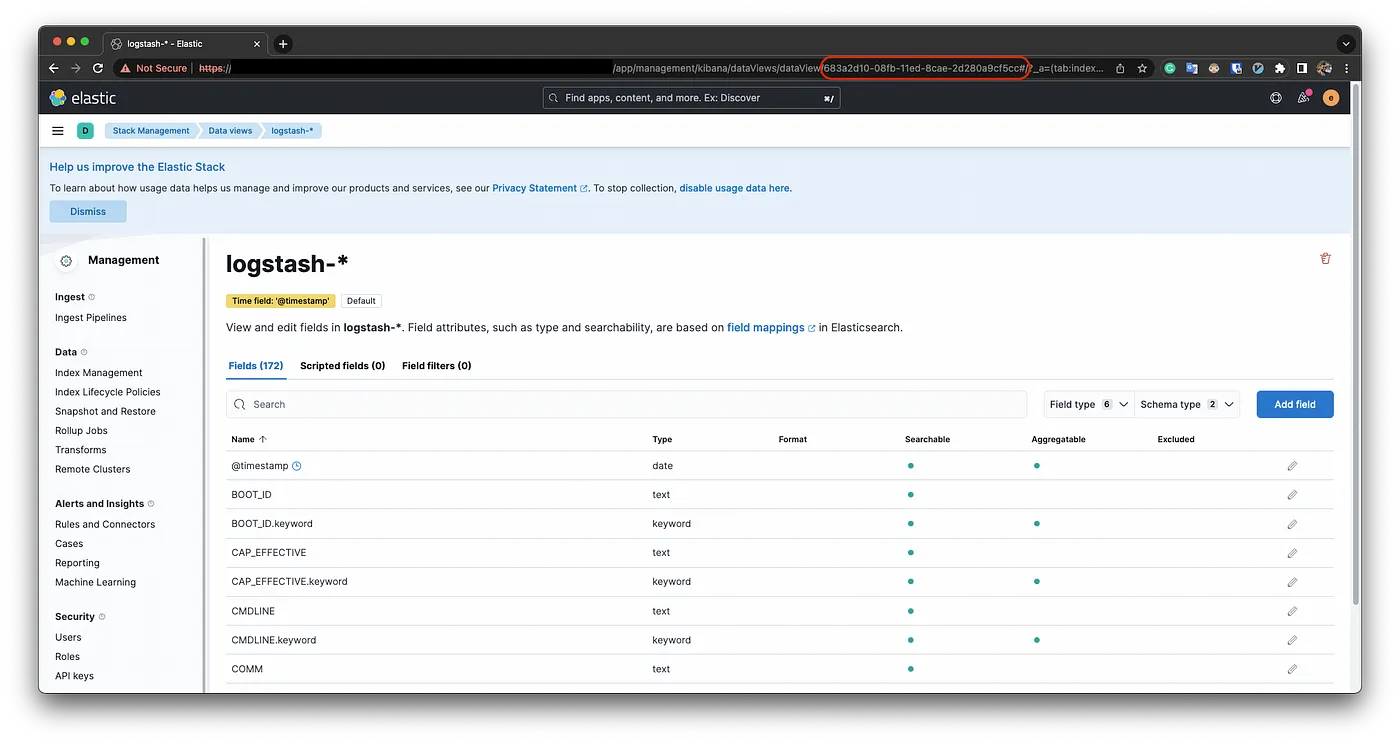
You’re expected to get a NDJSON output, save it as a file, and you’ll use it later.
Exporting Kibana Dashboards using Kibana API
Now, after we exported the data view, we would like to export our dashboards the same way (make sure you are replacing ${KIBANA_URL}, ${KIBANA_PORT}, user:pwd, and lastly the ${DASHBOARD_ID}):
curl - user user:pwd -X GET
"https://{KIBANA_URL}:{KIBANA_PORT}/api/kibana/dashboards/export?dashboard={DASH
BOARD_ID}" -H 'kbn-xsrf: true'
You can get the ID by navigating to the dashboard web page on the Kibana UI, and you’ll find the ID at the address bar as a part of the URI.
Import data-view using Kibana API
After you exported your data view by the command I mentioned above, you can now import it using the following command:
curl - user user:pwd -X POST
https://${KIBANA_URL}:${KIBANA_PORT}/api/saved_objects/_import -H "kbn-xsrf:
true" - form file=@${DATA_VIEW_FILE}.ndjson -H 'kbn-xsrf: true'
The ${DATA_VIEW_FILE} is the file name that you have exported the data view into.
Import dashboards using Kibana API
Of course, you would like to show some data in dashboards, and fortunately, you have a dashboard you’ve exported just before using the steps above. Now you just need to run the command:
curl - user user:pwd -X POST
https://${KIBANA_URL}:${KIBANA_PORT}/api/kibana/dashboards/import?exclude=index-
pattern -H 'kbn-xsrf: true' -H 'Content-Type: application/json' -d
@${DASHBOARD_FILE}.json
*Optionally — you can run a curl command with -d ‘ <JSON_DATA>’ instead of file path.
Import as a part of your Helm chart
So the exciting part is here: sometimes we want to import data views and dashboards as a part of the Helm chart itself or maybe as a post-process that happens after the Helm chart installation.
It can be done by Kubernetes Jobs. We will also use Kubernetes ConfigMaps in order to bring our objects’ JSON data inside the container.
Dashboards & data views as ConfigMap
First, we’ll create a ConfigMap which includes:
1. Shell script that curls the Kibana API (to import the data views & the dashboards)
2. A JSON file of a dashboard
3. A NDJSON file of a data view
apiVersion: v1
kind: ConfigMap
metadata:
name: kibana-data
data:


curl-script.sh: |
#!/bin/sh


#Wait for Kibana to be available & healthy
function wait_for_kibana {
echo "Testing connection to Kibana"
until $(curl -k -X GET https://${KIBANA_URL}:${KIBANA_PORT}/_cluster/health); do sleep 5; done
until [ "$(curl -k -X GET https://${KIBANA_URL}:${KIBANA_PORT}/_cluster/health | wc -l)" == "0" ]
do sleep 5
done
}


#Import data view
function import_data_view {
echo "Importing data_view..."
OUTPUT=$(curl -k --user user:pwd -X POST https://${KIBANA_URL}:${KIBANA_PORT}/api/saved_objects/_import -H "kbn-xsrf: true" --form file=@/kibana/file.ndjson)
SUCCESS=$(echo ${OUTPUT} | grep -o '"successCount":1' | wc -l)
if [[ ${SUCCESS} == "1" ]]; then
printf "\n########## Imported data view successfully! #############################\n"
else
printf "\n########## Failure while importing data view #############\n"
fi
echo ${OUTPUT}
}


#Import dashboards
function import_dashboards {
echo "Importing dashboards..."
OUTPUT=$(curl --user user:pwd -X POST https://${KIBANA_URL}:${KIBANA_PORT}/api/kibana/dashboards/import?exclude=index-pattern -H 'kbn-xsrf: true' -H 'Content-Type: application/json' -d @/kibana/file.json)
SUCCESS=$(echo ${OUTPUT} | grep -o '"successCount":1' | wc -l)
if [[ ${SUCCESS} == "1" ]]; then
printf "\n########## Imported dashboards successfully! #############################\n"
else
printf "\n########## Failure while importing dashboards #############\n"
fi
echo ${OUTPUT}
}


wait_for_kibana
import_data_view
import_dashboards


file.ndjson: |
{ A BEAUTIFUL NDJSON FORMAT DATA }


file.json: |
{ A BEAUTIFUL JSON FORMAT DATA }
The next step is to mount this ConfigMap as 3 different files inside the Job’s container, follow me.
Kubernetes Job as your handler!
We’ll now use a Kubernetes Job in order to:
1. Mount this ConfigMap to a container
2. Run the Shell script in order to send the API requests to the Kibana
Please note:
Obviously, you need a ready Kubernetes cluster.
You can add the ConfigMap and the Kubernetes Job to your EFK stack helm chart, or you can just run it statically at your cluster — this is really your choice following your needs.
apiVersion: batch/v1
kind: Job
metadata:
name: kibana-import
annotations:
"helm.sh/hook": post-install
"helm.sh/hook-weight": "5"
"helm.sh/hook-delete-policy": before-hook-creation,hook-succeeded
spec:
backoffLimit: 0
template:
spec:
restartPolicy: Never
volumes:
- name: kibana-data
configMap:
name: kibana-data
defaultMode: 0777
containers:
- name: kibana-import
image: centos/centos7
imagePullPolicy: IfNotPresent
env:
- name: KIBANA_URL
value: "{{ .Values.kibana.serviceName }}"
- name: KIBANA_PORT
value: "{{ .Values.kibana.port }}"
command: ["/bin/sh","/kibana/curl-script.sh"]
volumeMounts:
- name: kibana-data
mountPath: /kibana/
This job will run a single pod which will go down right after it finishes its task: Importing Kibana data view & dashboards.
NOTE: You can add the following helm-hook in the Job if you would want to continuously update dashboard, and not only after the first installation of the chart: "helm.sh/hook": post-upgrade
Summing up
To sum up, it would be much better to have the option to import data views and dashboards using Kubernetes ConfigMaps, but as we can’t do so today, I find the solution I described here very useful in order to add an import functionality to your Helm chart, and allow your developers to control their built-in dashboards & data views from the ConfigMap.
On one hand, you give them control but on the other hand, you do the import process for them, using Job.
You can also decide how you want to run this Kubernetes Job. In my case, I decided to add this Job to my ECK helm chart, and then when I deployed the EFK stack I already had some built-in dashboards & data view, but you can obviously decide how you want to use it.