
Introduction
In the scope of metric collection for Prometheus data sources, the Grafana Agent has emerged as a vital tool for DevOps developers. The lack of relevant and easily understandable documentation is a common problem faced by many companies. However, most of the documentation is written in a single, unorganized, long web page, with few examples that do not reflect the complexity, making it very hard to understand. In this article, I will shed light on common monitoring mistakes with Grafana, and share what I’ve learned and have significantly enhanced my understanding of the Grafana Agent and its configuration. Join me as we delve into the monitoring world and the challenges most of the people encounter along their work and gain a better understanding of the Grafana Agent configuration.
The Environment
Within a Kubernetes cluster’s Grafana namespace, various components coexist harmoniously. However, the main components of the Grafana Agent are as follows:
- Grafana Agent StatefulSet: This entity governs the very core of the agent, the agent pods themselves.
- ServiceAccount and RBAC: This configuration bestows the agent with requisite permissions, enabling it to operate seamlessly.
- Agent Service: This service facet serves a crucial purpose by exposing the agent to the wider environment.
- ConfigMap: Among the principal resources to be discussed, the ConfigMap serves as the repository for the agent’s configuration file. This component warrants our focused attention, as the agent’s metrics scraping behavior is intricately tied to the directives written within this configuration file.
The Problem
Let’s take a team who got the task to build custom dashboards and import other Grafana dashboards from the official Grafana Labs docs to their Grafana Cloud environment. Once they started exploring the dashboards, they noticed some metrics were missing. After further investigating, the team read an article, and as a result, they decided to add one job to the agent configuration file that changed the agent scraping jobs completely.
At first, the team was glad for solving the problem: The missing metrics had appeared on the dashboards, and all the missing data had appeared, but strangely some metrics had been duplicated as well. In addition, they were unaware that the usage amount had changed from $300 to $600 per month. They decided to scale the metrics scraping not only to the development environment but also staging and production. Unfortunately, they discovered that this solution caused the billing to be enormous!
At around 2 AM during the night, there was a spike to $1,250. What can we do to fix this problem and how can we save our costs in the future? Let’s investigate the situation and help our team.
The billing calculation in Grafana
Grafana metrics are based on active series ingestion per minute (DPM). This is done by considering two components: active series and data points per time (DPM). An active series is a time series (metrics) that receives new data points. For Hosted-Prometheus, a time series is considered active if new data points have been received within the last 15 to 30 minutes. Data points per minute (DPM) is the number of data points sent to Grafana Cloud Metrics per minute. This means that if the scrape interval is 60 seconds, then my DPM equals 1, so every active series will be taken once every minute. But if my scrape interval equals 30 seconds, my DPM will change to 2, and the active series will be taken twice every minute, affecting the billing to be higher.
Now the only missing piece to understand the billing calculation is understanding how active series are being calculated. Let’s take the time series ‘kube_node_info’, which has the label ‘cluster’, and let’s just say that all the nodes are part of the same cluster. So we are going to have only a one-time series:
kube_node_info{cluster="k8s-cluster"}This means that for 1 minute with 1 DPM we are going to have 1 time series. But now we are up to add another label which is ‘node_group’ that its values can be either ‘spot’ or ‘on_demand’ and try to calculate the number of possible time series:
kube_node_info{cluster="k8s-cluster", node_group="spot"}
kube_node_info{cluster="k8s-cluster", node_group="on_demand"}
Now- for 1 minute with 1 DPM, we are going to have 2 time series. That means that for every label name added to the scraping configs that have unique values, we are going to have more time series. This is called ‘high cardinality’.
Grafana agent configuration
When we know how to plan what we are going to be billed for, we can start analyzing the configuration file of the Grafana agent.
The file includes 5 different subjects:
- Metrics
- Integrations – configure integrations for the agent. For example, eventhandler – integration that watches Event resources in a Kubernetes cluster.
- Logs – configures log collection. For example, send the eventhandler event findings to Grafana loki.
- Server – used to enable self-scraping.
- Traces – configure traces trace collection.
All the subjects are important, and we can spend an entire day explaining all of them, but because the billing spike was caused by a misconfigured metrics section, We will be focusing on the first subject – metrics.
metrics:
  wal_directory: /var/lib/agent/wal
  global:
    scrape_interval: 60s
    external_labels:
      cluster: {{ .Values.cluster }}
  configs:
  - name: integrations
    remote_write:
    - url: {{ .Values.grafana_agent_prometheus.url }}
      basic_auth:
        username: {{ .Values.grafana_agent_prometheus.user }}
        password: {{.Values.password | b64dec }}
      write_relabel_configs:
      - source_labels: [__name__]
        regex: kube_node_info|container_cpu_usage_seconds_total
        action: keep
scrape_configs: - wal_directory: Write Ahead Log. In the event of a crash, there could be data loss, and the wal directory is a backup for the logs.
- global: global configs for the agent such as scrape_interval and external_labels.
- configs: The configuration itself… Every config has a name, remote_write, and scrape_configs.
- remote_write: list of data sources to write into.
- url: specify the Prometheus URL.
- basic_auth: username, password. For the data source connection.
- write_relabel_configs: We will deal with relabel configs in the jobs section, but the idea is to specify which time series you want to collect before sending them to the remote endpoint.
- scrape_configs: list of jobs to scrape the source metrics.
- remote_write: list of data sources to write into.
Jobs
We are about to learn the most critical phase of the file, but first, let’s look at a few terms to be familiar with:
- job_name: is simply the job name.
- static_configs: A static_config allows specifying a list of targets and a common label set for them.
- metric_relabel_configs : Metric relabeling is just filtering the metrics that we will use in the following job. It has the same configuration format and actions as target relabeling. One use for this is to exclude time series that are too expensive to ingest.
- bearer_token_file: path to authorization token.
- kubernetes_sd_configs: Kubernetes SD configurations allow retrieving scrape targets from Kubernetes REST API. For example, the “node” role type is used to discover node targets in the cluster and expose some related labels such as __meta_kubernetes_node_name or __meta_kubernetes_node_label_<labelname>, which we will be using later.
- relabel_configs: change the metrics labels while scraping to the data source.
To understand those terms, let’s look at a few examples:
scrape_configs:
- job_name: 'kube-system-aws-cluster-autoscaler/metrics'
  static_configs:
    - targets:
        - 'aws-cluster-autoscaler.kube-system:8085'
  metric_relabel_configs:
      - source_labels: [__name__]
        regex: cluster_autoscaler_.*
        action: keep
In this example, the target is the cluster autoscaler service. For the metric_relabel_configs, In our case, the ‘regex: cluster_autoscaler_.*’ and the action is “keep,” so that’s more like an “if” condition. “__name__” label is a Prometheus internal label that refers to the metric’s name. The agent will only “keep” metrics that their ‘name’ starts with “cluster_autoscaler_” like cluster_autoscaler_nodes_count or cluster_autoscaler_cluster_safe_to_autoscale . Other time series like kube_node_info won’t be scraped in this job.
Let’s check another example that is a little bit more complex: cadvisor. Container Advisor, is a tool used to monitor containers. It can collect, aggregate, process, and export container-based metrics such as CPU and memory usage, filesystem, and network statistics.
- bearer_token_file: /var/run/secrets/kubernetes.io/serviceaccount/token
  job_name: integrations/kubernetes/cadvisor
  kubernetes_sd_configs:
      - role: node
  metric_relabel_configs:
      - source_labels: [__name__]
        regex: container_memory_usage_bytes|container_cpu_usage_seconds_total
        action: keep
  relabel_configs:
      - replacement: kubernetes.default.svc.cluster.local:443
        target_label: __address__
      - regex: (.+)
        replacement: /api/v1/nodes/${1}/proxy/metrics/cadvisor
        source_labels:
          - __meta_kubernetes_node_name
        target_label: __metrics_path__
      - action: replace
        source_labels:
          - __meta_kubernetes_node_label_nodegroup
        target_label: nodegroup
  scheme: https
  tls_config:
      ca_file: /var/run/secrets/kubernetes.io/serviceaccount/ca.crt
      insecure_skip_verify: false
      server_name: kubernetes
The metric_relabel_configs holds the same purpose as the last example, but this time, we have two other cadvisor metrics to scrape by this job.
In the relabel_configs section, we have some label changes that will take place on the previous metric_relabel_configs metrics results.
Let’s explore them one by one:
The first is replacing the value of the internal label __address__ with the string “kubernetes.default.svc.cluster.local.443”. The __address__ label describes host:port of the scrape target. So, this relabel config defines the jobs target to be our cluster.
To understand the second configuration, we need to start from the source_labels result. __meta_kubernetes_node_name will return the node’s name to us. But in a Kubernetes cluster, we have many nodes so that the source labels result will return a group of our node names.
For example: node1, node2, node3
From this group, we will filter the values that match the regex section- in our case the regex is (.+) which stands for everything. Then the replacement section will replace our findings with the string /api/v1/nodes/${1}/proxy/metrics/cadvisor where ${1} stands for the source_label group results. In our example- node1, node2, and node3 will be replaced by:
/api/v1/nodes/node1/proxy/metrics/cadvisor
/api/v1/nodes/node2/proxy/metrics/cadvisor
/api/v1/nodes/node3/proxy/metrics/cadvisor
These values are going to present the target_label __metrics_path__ which is a Prometheus internal label that describes the metrics endpoint of the scrape target.
The last relabel configuration is replacing the Kubernetes node label ‘nodegroup’ and creating a new label in Prometheus called nodegroup.
The Last scenario I want to show you is about a relabel_config that matches only a specific label type.
relabel_configs:
  - action: keep
    regex: kube-state-metrics
    source_labels:
      - __meta_kubernetes_pod_label_app_kubernetes_io_name
This example shows that the job will only take place on targets where the pod label app_kubernetes_io_name equals kube-state-metrics.
And Now to the source of all our problems: the pod-metrics job
- job_name: pod-metrics
  kubernetes_sd_configs:
      - role: pod
  relabel_configs:
    - source_labels:
        - __meta_kubernetes_pod_node_name
      target_label: __host__
    - action: labelmap
      regex: __meta_kubernetes_pod_label_(.+)
    - action: replace
      replacement: $1
      separator: /
      source_labels:
        - __meta_kubernetes_namespace
        - __meta_kubernetes_pod_name
      target_label: job
    - action: replace
      source_labels:
        - __meta_kubernetes_namespace
      target_label: namespace
    - action: replace
      source_labels:
        - __meta_kubernetes_pod_name
      target_label: pod
    - action: replace
      source_labels:
        - __meta_kubernetes_pod_container_name
      target_label: container
    - action: replace
      source_labels:
        - __meta_kubernetes_pod_label_app
      target_label: app
So, what caused the spike in Grafana Cloud billing – what can we learn?
- There is no metric_relabel_configs section. It means that this job is going to scrape every single time series that it gets its hands on! Moreover, there is no ‘keep’ action in the relabel_configs section, so the job will scrape all the metrics on all the pods.
- The labelmap action. This is a deadly action that gets all the labels from a pod by the source_label __meta_kubernetes_pod_label_(.+), which refers to all the labels (!!!), and adds them as key=value pairs to the time series while scraping the metrics in this job. Remember the term high-cardinality from before? So what about HUGE-CARDINALITY?
- job target_label. This configuration takes the namespace and the pod name of the target, and replaces them with a new label called job, and every pod gets its own unique value. Have I mentioned HUGE-CARDINALITY already?
Things you need to do to solve Grafana metrics scraping problem
- The first thing they had to do of course, is to shut down the Grafana agent for debugging purposes. Then, after understanding the causes of their problem, take further action.
- Delete the problematic job or modify it regarding your needs – to reduce the billable active series. This step will immediately affect the DPM calculation in the cloud.
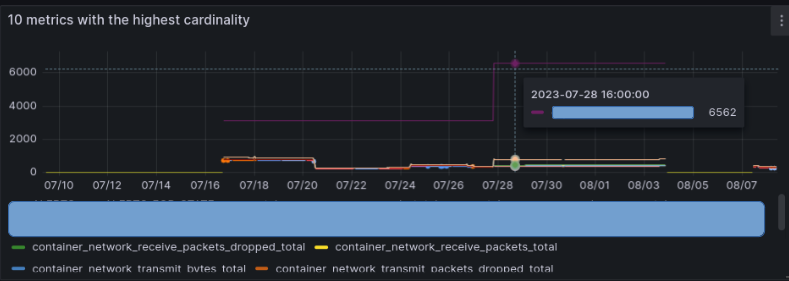
- Also, When investigating the metrics highest usage the team realized that some metrics are used many times and are not much needed in their project.
One metric had the highest cardinality by far from the others, and we realized that we don’t need the panels that are using it. With metric_relabel_configs and write_relabel_configs we dropped that metric.
The effect:
As you can see from three environments and a total of about 200,000 billable metrics ingestion rate, it was reduced to only 10,000. Specifically, in this case, they decided to remove the development and staging environment monitoring to reduce the costs.

Conclusion
The Grafana agent is useful for scraping metrics into your data source. The way it’s doing it is configured by the agent’s configuration file. When we don’t configure the file right, we can get a very high billing due to active series and data points per time(DPM). The Active series are affected by the number of metrics scraped and the number of label names and values per metric. As long as we are able to understand its language, we can change its properties and reduce our costs.